What is a KPI: Understanding Key Performance Indicators to Support Business Processes
KPIs (key performance indicators)—Progress tracking metrics that allow you to measure and evaluate the progress toward a specific goal. They are used in various areas of business, including marketing, sales, HR, and production KPIs.—milestones for assessing progress and simultaneously providing analytical data. They help employees make informed decisions to move forward at a strategic level. According to the data serviceGlobal Growth Insights Approximately 41% of IT companies participating in the study use KPI dashboards to monitor performance in real time. Interest in them is growing every year.
KPI (Key Performance Indicators) value
Understanding what KPI is—These are significant financial and non-financial indicators, providing insight into the importance of their measurement. For proper operational and strategic development, it is necessary to consider:
- KPI—Key performance indicator. Accurate data gives a company a clear understanding of its progress toward its stated goal. Measuring KPIs allows for strategy adjustments and optimization of operations to achieve desired results.
- Employee KPI—A specific, measurable indicator of a specialist’s productivity. It is important for developing a fair compensation system, monitoring employee performance, and motivating them.
- KPI system—A performance evaluation method based on a set of measurable indicators. It is a comprehensive platform that helps managers determine the degree to which a company or organization is achieving its strategic and tactical goals.
The core idea of working with KPIs is clearly demonstrated by the quote of a successful American entrepreneur: “In business, what gets measured gets improved.” This means that there is a direct correlation between performance indicators and company growth.
The Importance of Key Performance Indicators
Working with KPIs at enterprises and organizations in any field of activity allows for the following:
- Performance monitoring and measurement. Performance indicators transform abstract business goals into concrete, quantifiable metrics.
- Identifying strengths and weaknesses. KPIs help determine which processes in a company are being implemented effectively and which require improvement. For example, a sales conversion rate below expectations is a signal that the customer engagement strategy or employee training needs to be adjusted.
- Making informed decisions. KPIs allow managers and executives to quickly respond to changes, reallocate resources, and adjust development strategies. This is done based on real data, not assumptions.
- Focus and motivation for the team. Thanks to KPIs, company employees know exactly what results management expects from them. Setting specific, measurable goals helps the team focus on key areas.
- Transparency and accountability of processes. KPIs allow us to accurately determine which actions lead to the achievement of goals, and which—No. Each employee or department is responsible for a specific amount of work. There is a clear understanding of who is expected to deliver a certain result.
KPIs not only accurately reflect the current state of affairs, but also help predict future results according to the company Foundernest the share of organizations tracking 5 or more KPIs has grown from 22% in 2015 to 63% in 2025. By measuring and accounting for performance indicators, executives and analysts can anticipate potential risks and opportunities.
Types of KPIs
KPIs are typically classified by various criteria, such as the type of information they provide and the company’s areas of activity. Let’s look at the most common KPIs:
- Strategic—reflect the overall health of the company and its progress toward long-term goals. They help assess profitability, market share, and customer satisfaction. For example, EBITDA—earnings before interest, taxes, depreciation, and amortization (NPS)—customer loyalty index.
- Operating—Focus on the efficiency of day-to-day business processes. Key Performance Indicators help evaluate order processing speed, resource utilization, and team productivity. For example, AHT—average processing time, CRR—customer retention rate.
- Financial—reflect the profitability and efficiency of resource management. For example, ROI—return on investment, ROE—return on equity.
- Marketing—measure the effectiveness of advertising campaigns and brand strategies. For example, CAC—customer acquisition cost, LTV—customer lifetime value, CTR—clickability.
- Absolute—Specific numerical values that provide precise information about the necessary metrics. For example, the number of products sold, the number of customers acquired, or the average order value.
- Relative—They are calculated as percentages or ratios of certain values. These key performance indicators allow for comparisons across different conditions or time periods. For example, the conversion rate helps evaluate the effectiveness of advertising campaigns by comparing visitors with buyers.
- Short-term—are used to monitor operational tasks. For example, SR—FCR (Fast Response Time)—problem resolution on first contact.
- Long-term—help evaluate business progress over months and years. For example, CRR—customer retention rate, CAGR—average annual growth rate of the market.
- Lagging—reflect the results of past actions. For example, quarterly profit or market share after a marketing campaign.
- Leading—indicate future trends. For example, counting the number of new leads provides an idea of the expected future sales growth.
Companies don’t need to measure every KPI. Among the commonly used ones, they should select those that reflect the success of certain actions, initiatives, or resource deployment.
How to choose the right key performance indicators for specific areas of activity
There’s no universal approach to selecting KPIs. The set of relevant indicators is determined by the specifics of the business, the type of operations, strategic goals, and other factors. To select the most relevant KPIs from existing ones, it’s necessary to analyse:
- Business type. For B2C, customer interaction control is a priority. Key KPIs: customer satisfaction, conversion rate, sales revenue. In B2B models, long-term partnerships, scaling, and evaluating negotiation effectiveness are important. Key KPIs: number of closed deals and new contracts, partner satisfaction.
- Industry. In e-commerce, key performance indicators—average order value and customer acquisition rate, conversion rate. For service companies, – order fulfillment speed, customer satisfaction, and repeat purchases. For manufacturing companies—volume of manufactured products, their cost and quality, efficiency of resource use.
- Strategic business goals. For companies focused on rapid growth, KPIs should focus on revenue growth, market expansion, and customer base growth. If business stability is a priority, KPIs reflecting cost optimization and improving customer retention should be considered.
- The company’s internal specifics. For companies focused on developing new products, the number of product categories and the time to market are important. If the priority—Quality requires taking into account the percentage of positive customer reviews, the number of complaints, and warranty claims.
Measuring all performance indicators takes more time, and there’s no guarantee that the resulting data will be used correctly and in a timely manner. It’s important to focus on those metrics that play a key role in achieving business goals.
Examples of KPIs for different positions
A few examples will help you understand what it means to identify key performance indicators.
KPIs for accountants
Among the key indicators for assessing performance are:
- accuracy of financial reporting;
- speed of accounting operations;
- timeliness of tax reporting.
KPIs for sales managers
Their effectiveness is tied to quantitative and financial indicators. Among the main ones:
- sales volume;
- number of new clients;
- average order value;
- lead to customer conversion rate.
The general algorithm for calculating KPIs involves several simple steps: defining a goal, creating a simple formula, choosing a measurement period, and interpreting the results. However, without professional knowledge and skills, this can be a challenging task. The team at the Art-Marks advertising agency has been successfully working with projects of varying complexity for over five years. We help develop businesses and take them to the next level. We successfully implement complex projects using proven tools. We will define KPIs for your business to accelerate the achievement of even the most ambitious goals.
References:
- Kaplan, R. S. & Norton, D. P. (1992). The Balanced Scorecard: Measures That Drive Performance. Harvard Business Review, January–February, 71–79.
- Key Performance Indicators for Dummies./Marr, B.//—Wiley—2021—pp. 110–183
It might also be interesting
See all


Marketing funnel: why businesses need it
In today’s business, when there are many tools to promote a product, marketing strategy becomes overgrown with details that are often difficult to link together. The sales funnel is a model of consumer interactions with a brand, from first encounter to repeat sales. It helps to understand what measures really bring results, where to improve the system and at what point potential customers are “lost”. However, it is only through a deep study of each stage that the full potential of this tool can be utilised.*** Translated with www.DeepL.com/Translator (free version) ***
What is a sales funnel and why to implement it
The marketing funnel allows you to visualise the “customer journey” not only in terms of one promotional channel, but of all interactions. This approach helps to track results at different stages and improve them. Valuable information that the model provides:
- the number of potential customers at each stage of interaction;
- conversion rate by stage – the percentage of people moving from one stage to another;
- “bottlenecks” in sales, where customers “drop out”;
- the effectiveness of each individual promotion channel and campaigns;
- which products, promotions or content are resonating;
- sales forecasting and growth potential based on current conversion rates;
- how many customers return and recommend the product to others;
- return on investment in advertising.
This data gives a clear picture of the customer journey, allows you to improve it and then already “lead” a potential customer with a pre-planned “route”.
The main stages of the marketing funnel
All modern interpretations of the sales funnel are based on the AIDA model, described by the pioneer of marketing – American advertiser Elias St. Elmo Lewis (Elias St. Elmo Lewis). Elias St. Elmo Lewis (Elias St. Elmo Lewis) in his publications in trade publications of the late XIX – early XX century. He was the first to formulate the sequence:
AIDA: Attention → Interest → Desire → Action
Today, marketers are also adding a fifth stage – loyalty. It has taken an important place in the sales funnel, because attracting new customers is much more expensive for a company than retaining them. So, what is the essence of each stage of interaction:
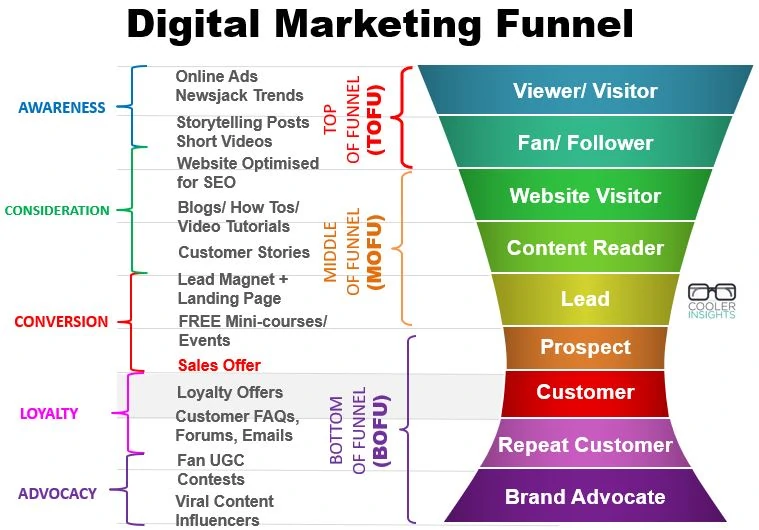
- Attention/awareness – determines the first contact, informs the audience about the existence of the brand.
- Interest/consideration – the company remains in the memory, and the user starts looking for more information about it.
- Desire – the visitor becomes a lead, a potential customer who already has an idea of how the brand can be useful to him.
- Conversion – the user performs the target action to which the funnel was leading, mainly a purchase.
- Loyalty – the customer makes repeat purchases, becomes loyal to the brand and recommends it to others.
Detailed marketing funnel proposed by the company Cooler Insights:
How to build a sales funnel
In a comprehensive set of statistics compiled by an independent publication for content makers Ecommerce Bonsai, Among other things, it says that 90 per cent of users are not ready to buy a product after visiting the site for the first time. Moreover, the consulting company EmailToolTester, has determined that the number of customer interactions can vary from 1 to 50 depending on the industry and audience. This is why a well-designed sales funnel becomes a priority for marketers. The basic steps of building one:
- Establish goals and key metrics.
- Define the target audience and map out the customer journey from brand awareness to purchase and retention.
- Create content and offers for each stage.
- Set up conversion points and connect tools (lendings, CRM, email).
- Track key metrics and customer behaviour.
- Automate communications and lead warming.
- Test and improve the funnel based on results.
A detailed sales funnel should include information on the stages of customer touchpoints, targeted actions, channels and tools to be used to motivate users.
Examples of building marketing funnels
Funnel for e-commerce
The e-commerce marketing funnel focuses on a quick buying cycle and maximising conversions on the website. The main goal is to engage the user, convince them of the value of the product and encourage them to buy, then retain them through loyalty programmes and repeat sales.
| Stage | Customer action | Channels | Instruments | Metrics / KPIs |
| Awareness | Sees an advert or social media post | Instagram, Facebook, Google Ads | Targeted advertising, banners | Reach, CTR, number of unique visitors |
| Interest | Reviews products, reads reviews | Website, email | Lead magnets, mailings, recommendations | Number of pages viewed, CTR, % of subscriptions |
| Consideration | Compares items, adds to basket | Website, email | Chat with a consultant, product comparison | Adds to basket, clicks on CTA, % engaged |
| Decision | Placing an order | Website | Shopping cart, coupons, remarketing | % of completed orders, average cheque, revenue |
| Retention | Repeat purchases, newsletter subscription | Email, social media | Loyalty programmes, promotions, recommendations | % of repeat purchases, LTV, NPSTV, NPS |
Funnel for B2B service
The B2B funnel is longer and more complex as decisions are made by a group of individuals and require ROI evaluation. The main focus is on building trust through content, demos, case studies and personal consultations. More information on what a B2B sales funnel is and its specifics can be found in this article HubSpot, a leading inbound marketing company.
| Stage | Customer action | Channels | Instruments | Metrics / KPIs |
| Awareness | Learns about the service, reads articles | LinkedIn, blog, email | SEO, content marketing, LinkedIn advertising | Traffic, blog views, CTR of adverts |
| Interest | Downloads a case study or a guide | Website, email | Lead magnet, email nurture-chain | Number of leads, subscriptions, CTR of emails |
| Consideration | Requests a demo or consultation | Website, phone call, email | Webinars, ROI calculator, consultations | Demo requests, % of conversion to MQL, engagement |
| Decision | Service subscription or contract | CRM, email | Special offers, tripwire, personalised offers | % of conversion to sale, CAC, average cheque |
| Retention | Subscription renewal, upsale | Email, account manager | Automation, drip campaigns, upsell | % renewal, LTV, NPS, number of recommendations |
Content marketing funnel
The sales funnel example for content marketing focuses on creating value and trust through useful content. The goal is to engage audiences, build brand expertise, and gradually warm users up to a subscription or purchase.
| Stage | Customer action | Channels | Instruments | Metrics / KPIs |
| Awareness | Finds an article or video | Blog, social media, YouTube | SEO, SMM, video, infographics | Traffic, views, CTR, reach |
| Interest | Reads/views the material, signs off | Email, blog | Email newsletters, free materials, webinars | Subscriptions, email CTR, average time on page |
| Consideration | Studies cases, evaluates the product | Website, email | Detailed guides, checklists, consultations | Downloads of materials, consultation requests, CTRs |
| Decision | Subscription to a paid course/product | Website, email | Tripwire, promotions, personalised offers | % of conversion to purchase, revenue, average cheque |
| Retention | Continues to use, shares content | Email, social media | New content, mailing list, community, recommendations | % of repeat subscribers, LTV, engagement, NPS |
Evaluating the results of sales funnel implementation
Once the sales funnel has been implemented, it is important to regularly evaluate its effectiveness and make adjustments. The main goal is to understand how well customers are converting at each stage, where losses occur, and which tools work best:
- Traffic and Reach – how many potential customers learnt about your product.
- Conversion by stage – the percentage of customers moving from Awareness to Interest, Consideration and Decision.
- CPL / CAC – the cost to attract a lead or customer.
- AOV (average cheque) and LTV – how much a customer brings in on average and how long they stay with you.
- NPS and Satisfaction – how satisfied customers are with the product and are willing to recommend you to others.
- Retention / repeat purchases – a measure of retention and engagement.
Regular analysis of these metrics allows you to identify bottlenecks in the funnel, improve content and offerers, as well as increase overall conversion and efficiency of advertising investments.As you can see, building a sales funnel is a complex and time-consuming process that requires not only a deep understanding of the industry and audience, but also marketing tools. Art-Marks team manages to build a client’s path with careful elaboration of stages and adaptation to the client’s business. This is possible thanks to the experience of co-operation with companies from different spheres and the comprehensive use of digital promotion channels.
*** Translated with www.DeepL.com/Translator (free version) ***